Usability Study for HTC Print Studio
- Goal: Run usability tests on the HTC Print Studio app and translate findings into actionable recommendations.
Introduction
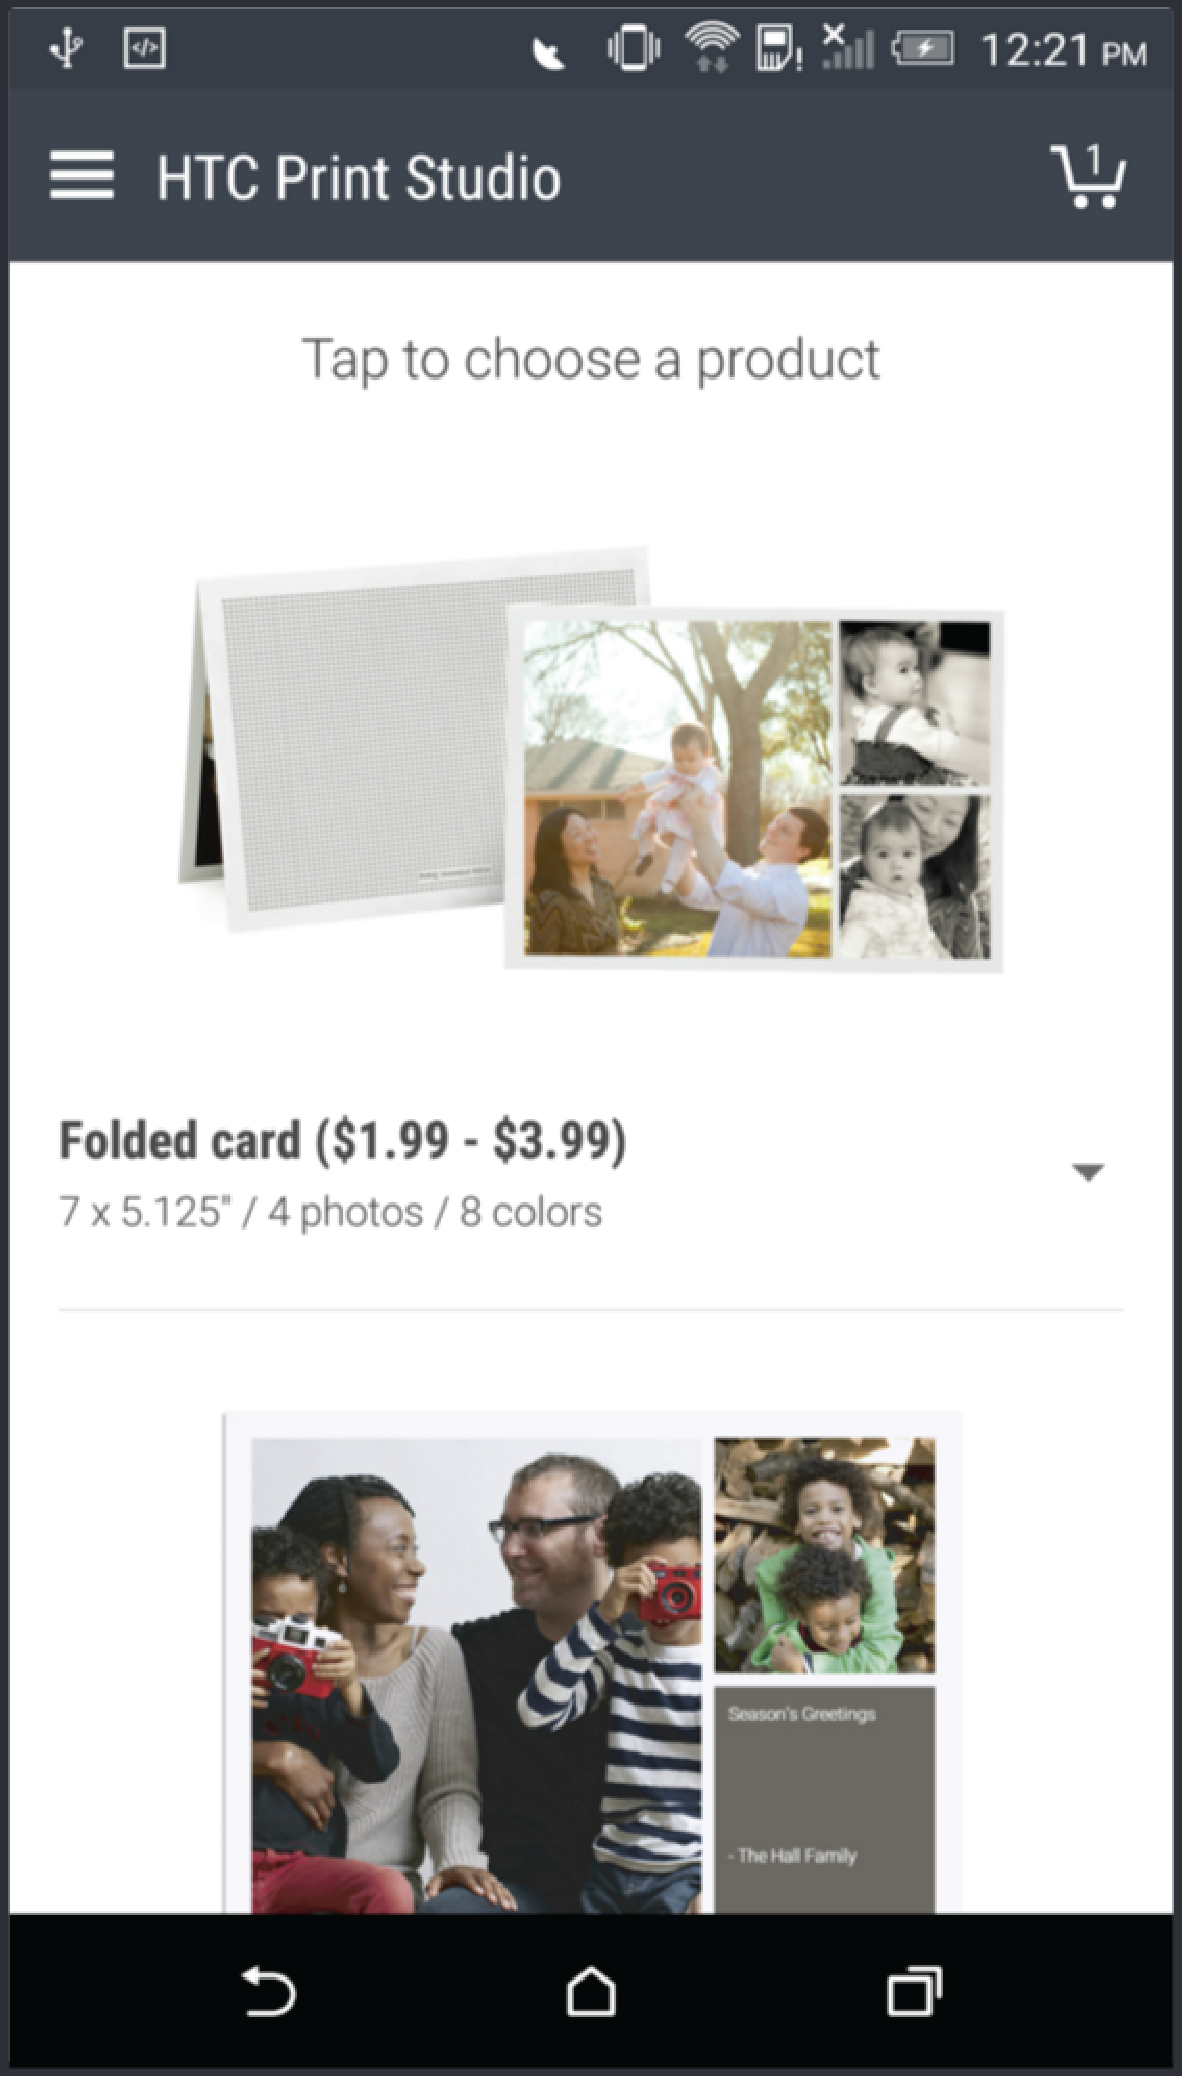
HTC Print Studio is a pre-installed application for some version of HTC Android devices, which allows users to buy personalized photo products such as cards and magnets.
Four researchers including myself conducted the usability study on this application. Our objective was to find:
- How easily can the participants edit their photos? (remove red eye, add filteres, etc.)
- How easily can the participants customize their product? (add messages, change card color, etc)
- How easily can the participants complete the checkout process?
- Wrote an orientation script
- Prepared the NDA (provided by HTC) and Consent form
- Recruited participants for the study (3 of 8 total)
- Decided tools to use for surveys and data collection, such as:
SurveyMonkey Created a screener to filter candidates who participated in the usability study.
Google Forms
Created a screener to filter candidates who participated in the usability study.
Google Forms Used google forms to log answers to pre-test questionnaires, post-task questionnaires, and post-test questionnaires.
Morae Software
Used google forms to log answers to pre-test questionnaires, post-task questionnaires, and post-test questionnaires.
Morae Software This software was useful to record video and add timeline notes allowing easy reference to comments, quotes, or simple observations.
- For each of our tests we set up the room as the following image shows:
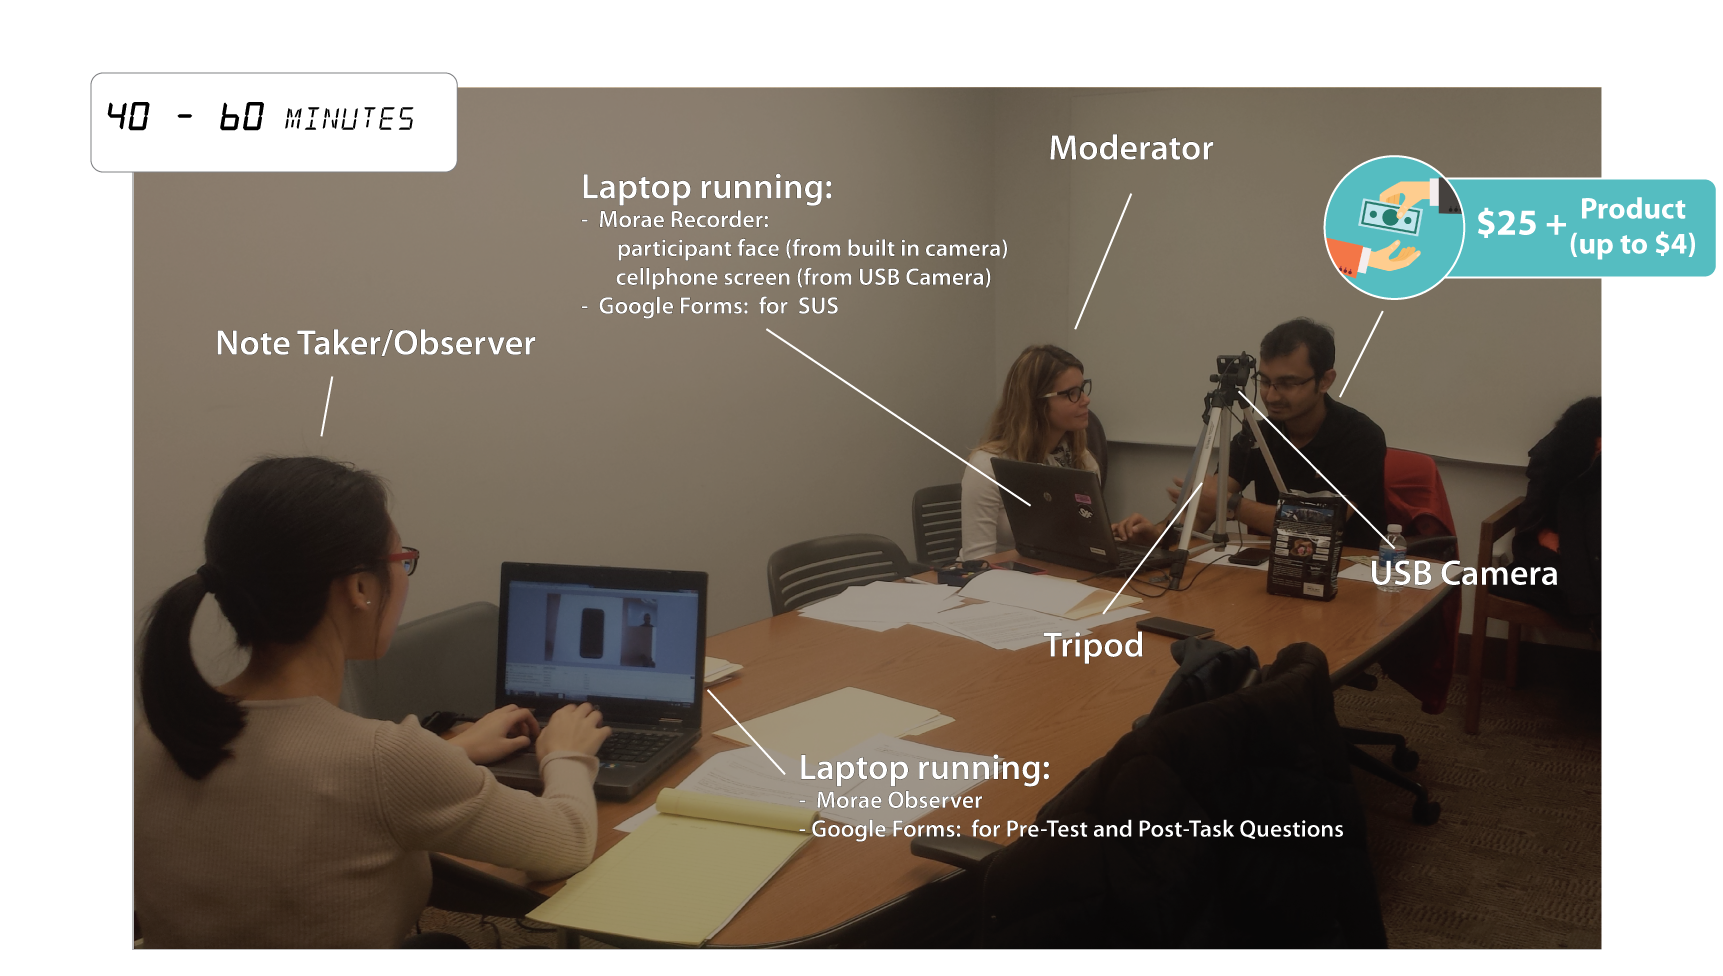
This is a picture that I took from one of our eight tests.
- On each session we asked the users to perform a set of tasks that required them to use the majority of the tools in the HTC Print Studio application.
- After each task we asked the participant the rating and comments for the different tools that were used to accomplish the task.
- I was note taker/observer for 2 tests
- I was moderator for 2 tests
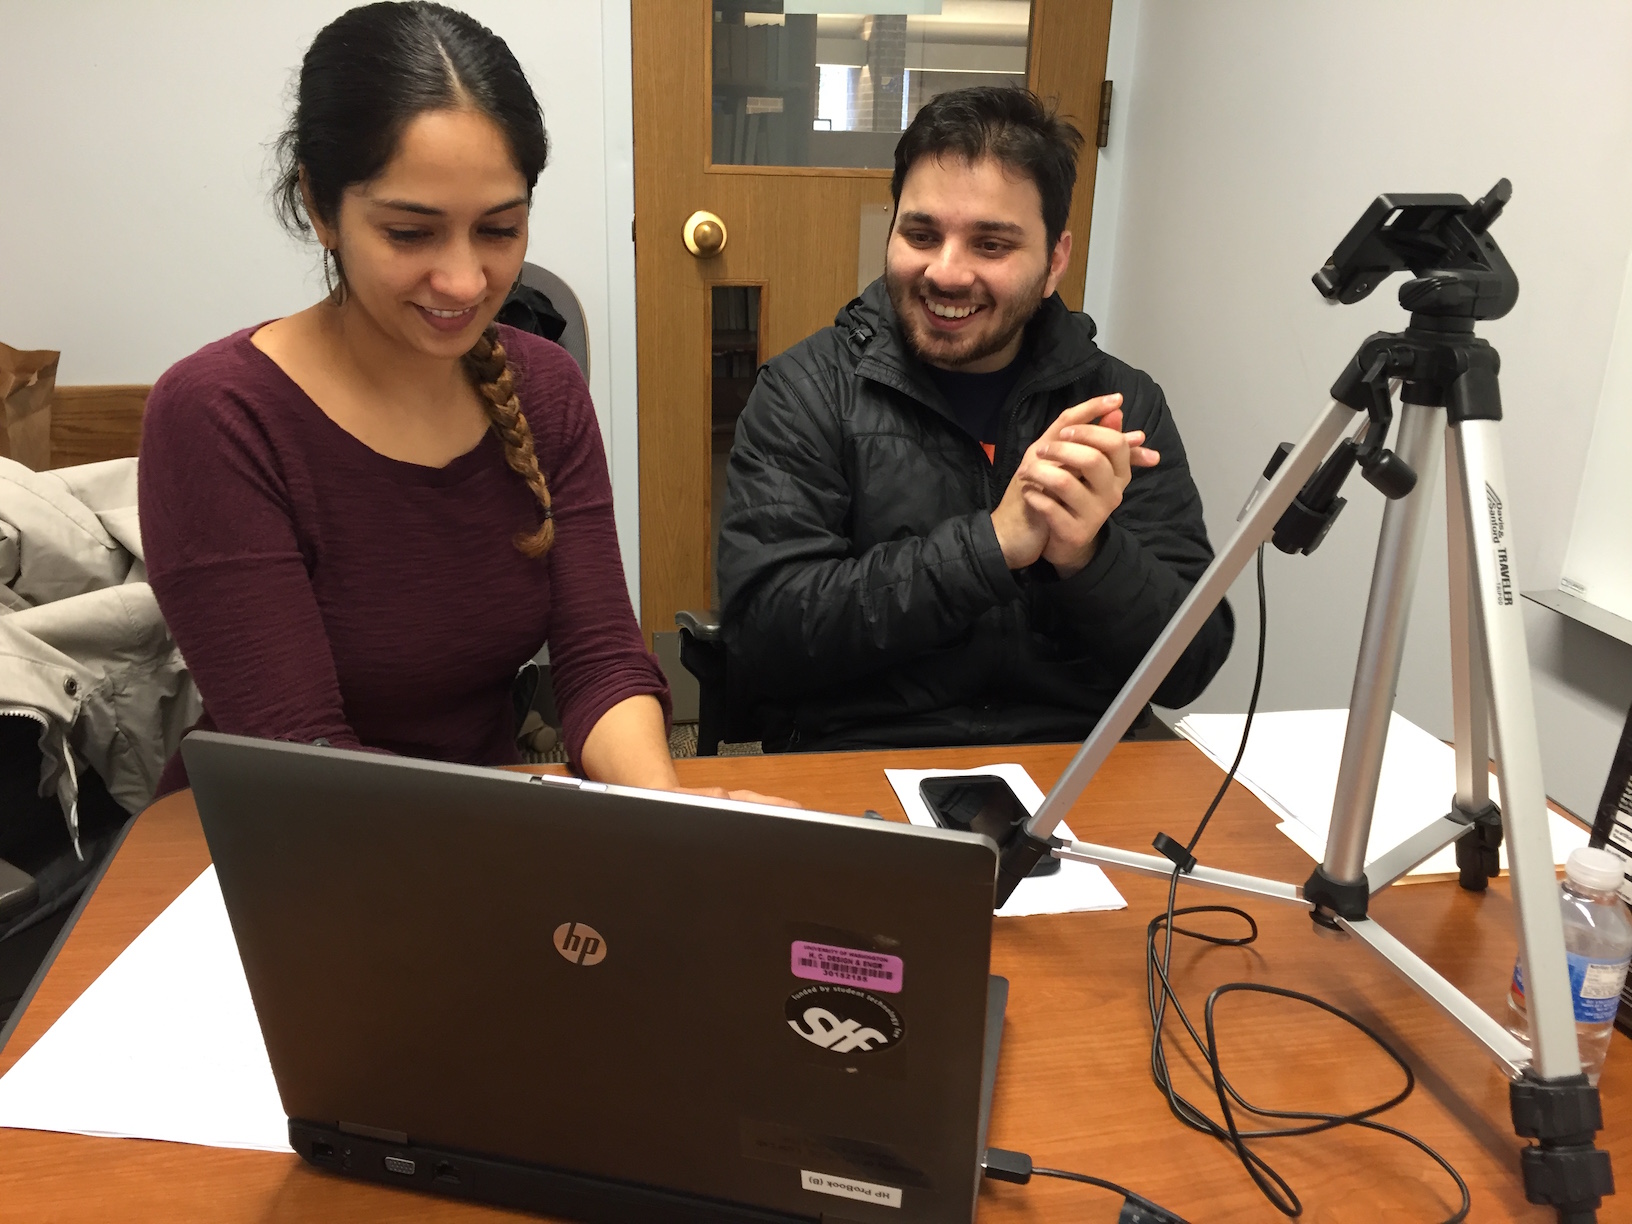
This is a picture from one of the two sessions I moderated.
- We selected a severity scale (from 1-being most severe to 4-beign a subtle problem) to mark each one of the issues.
- We categorized each of the issue related to the section of the application that it belongs.
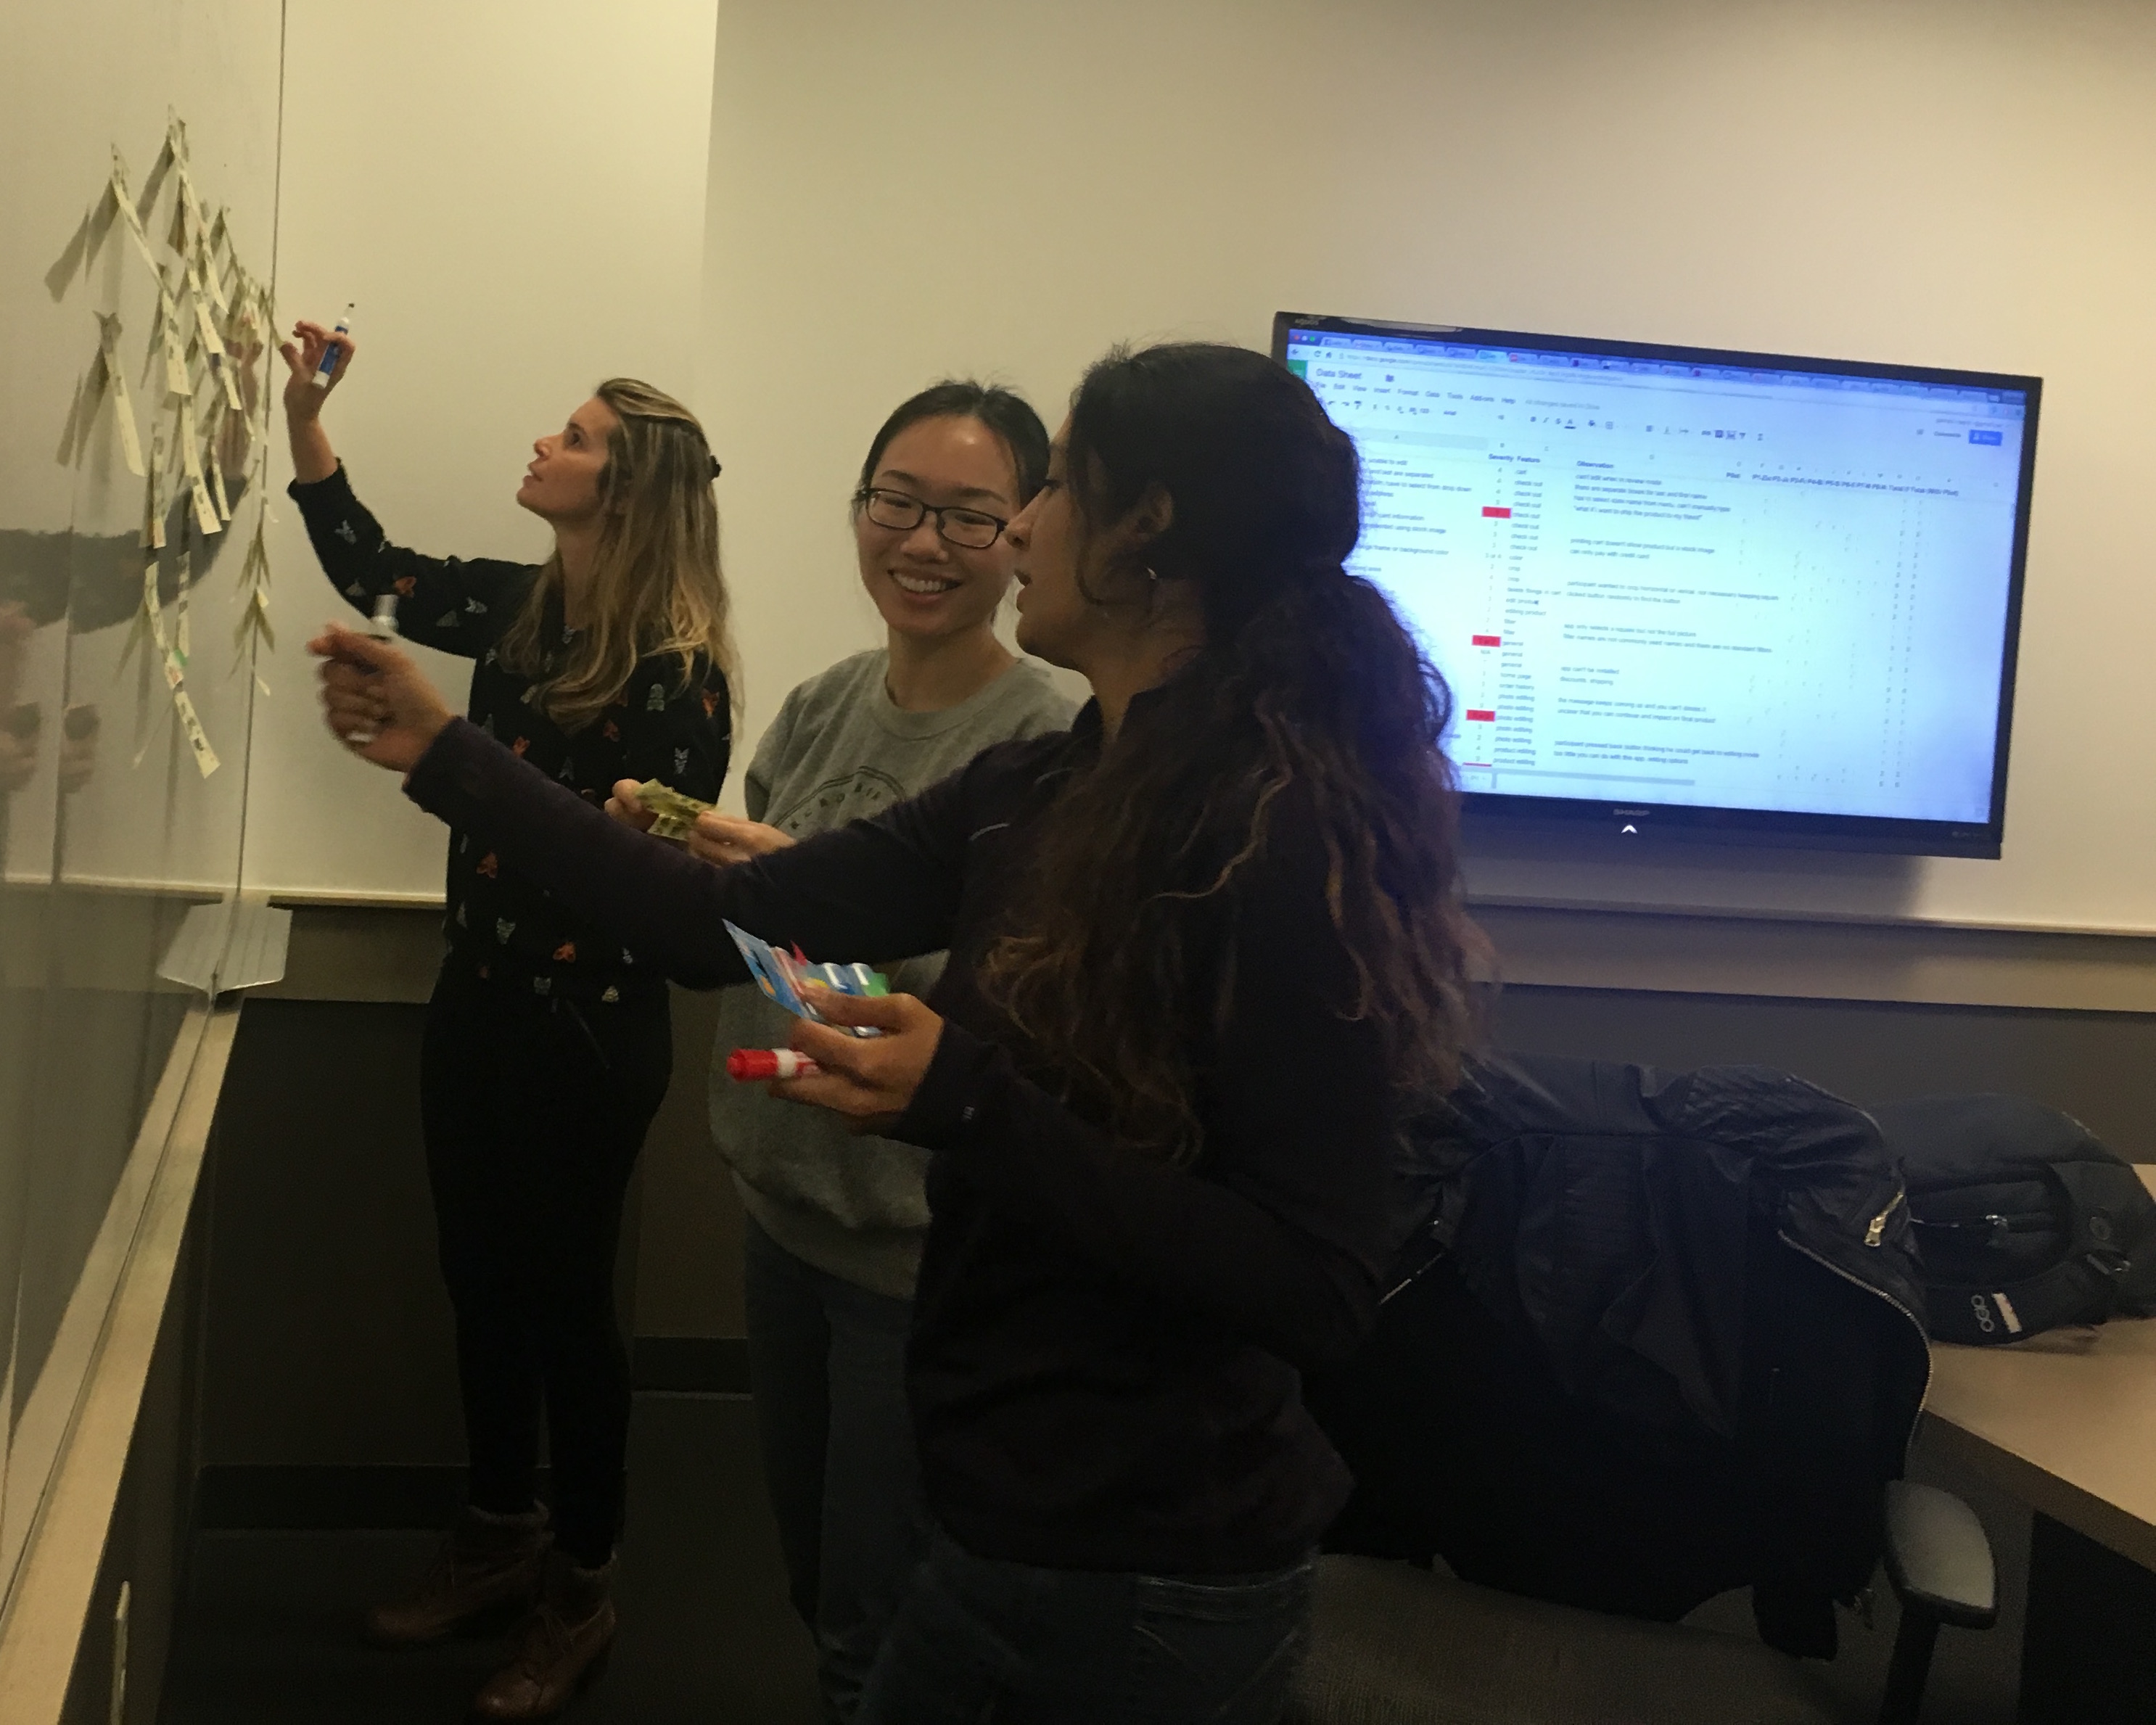
Here, two team members and I categorizing the issues.
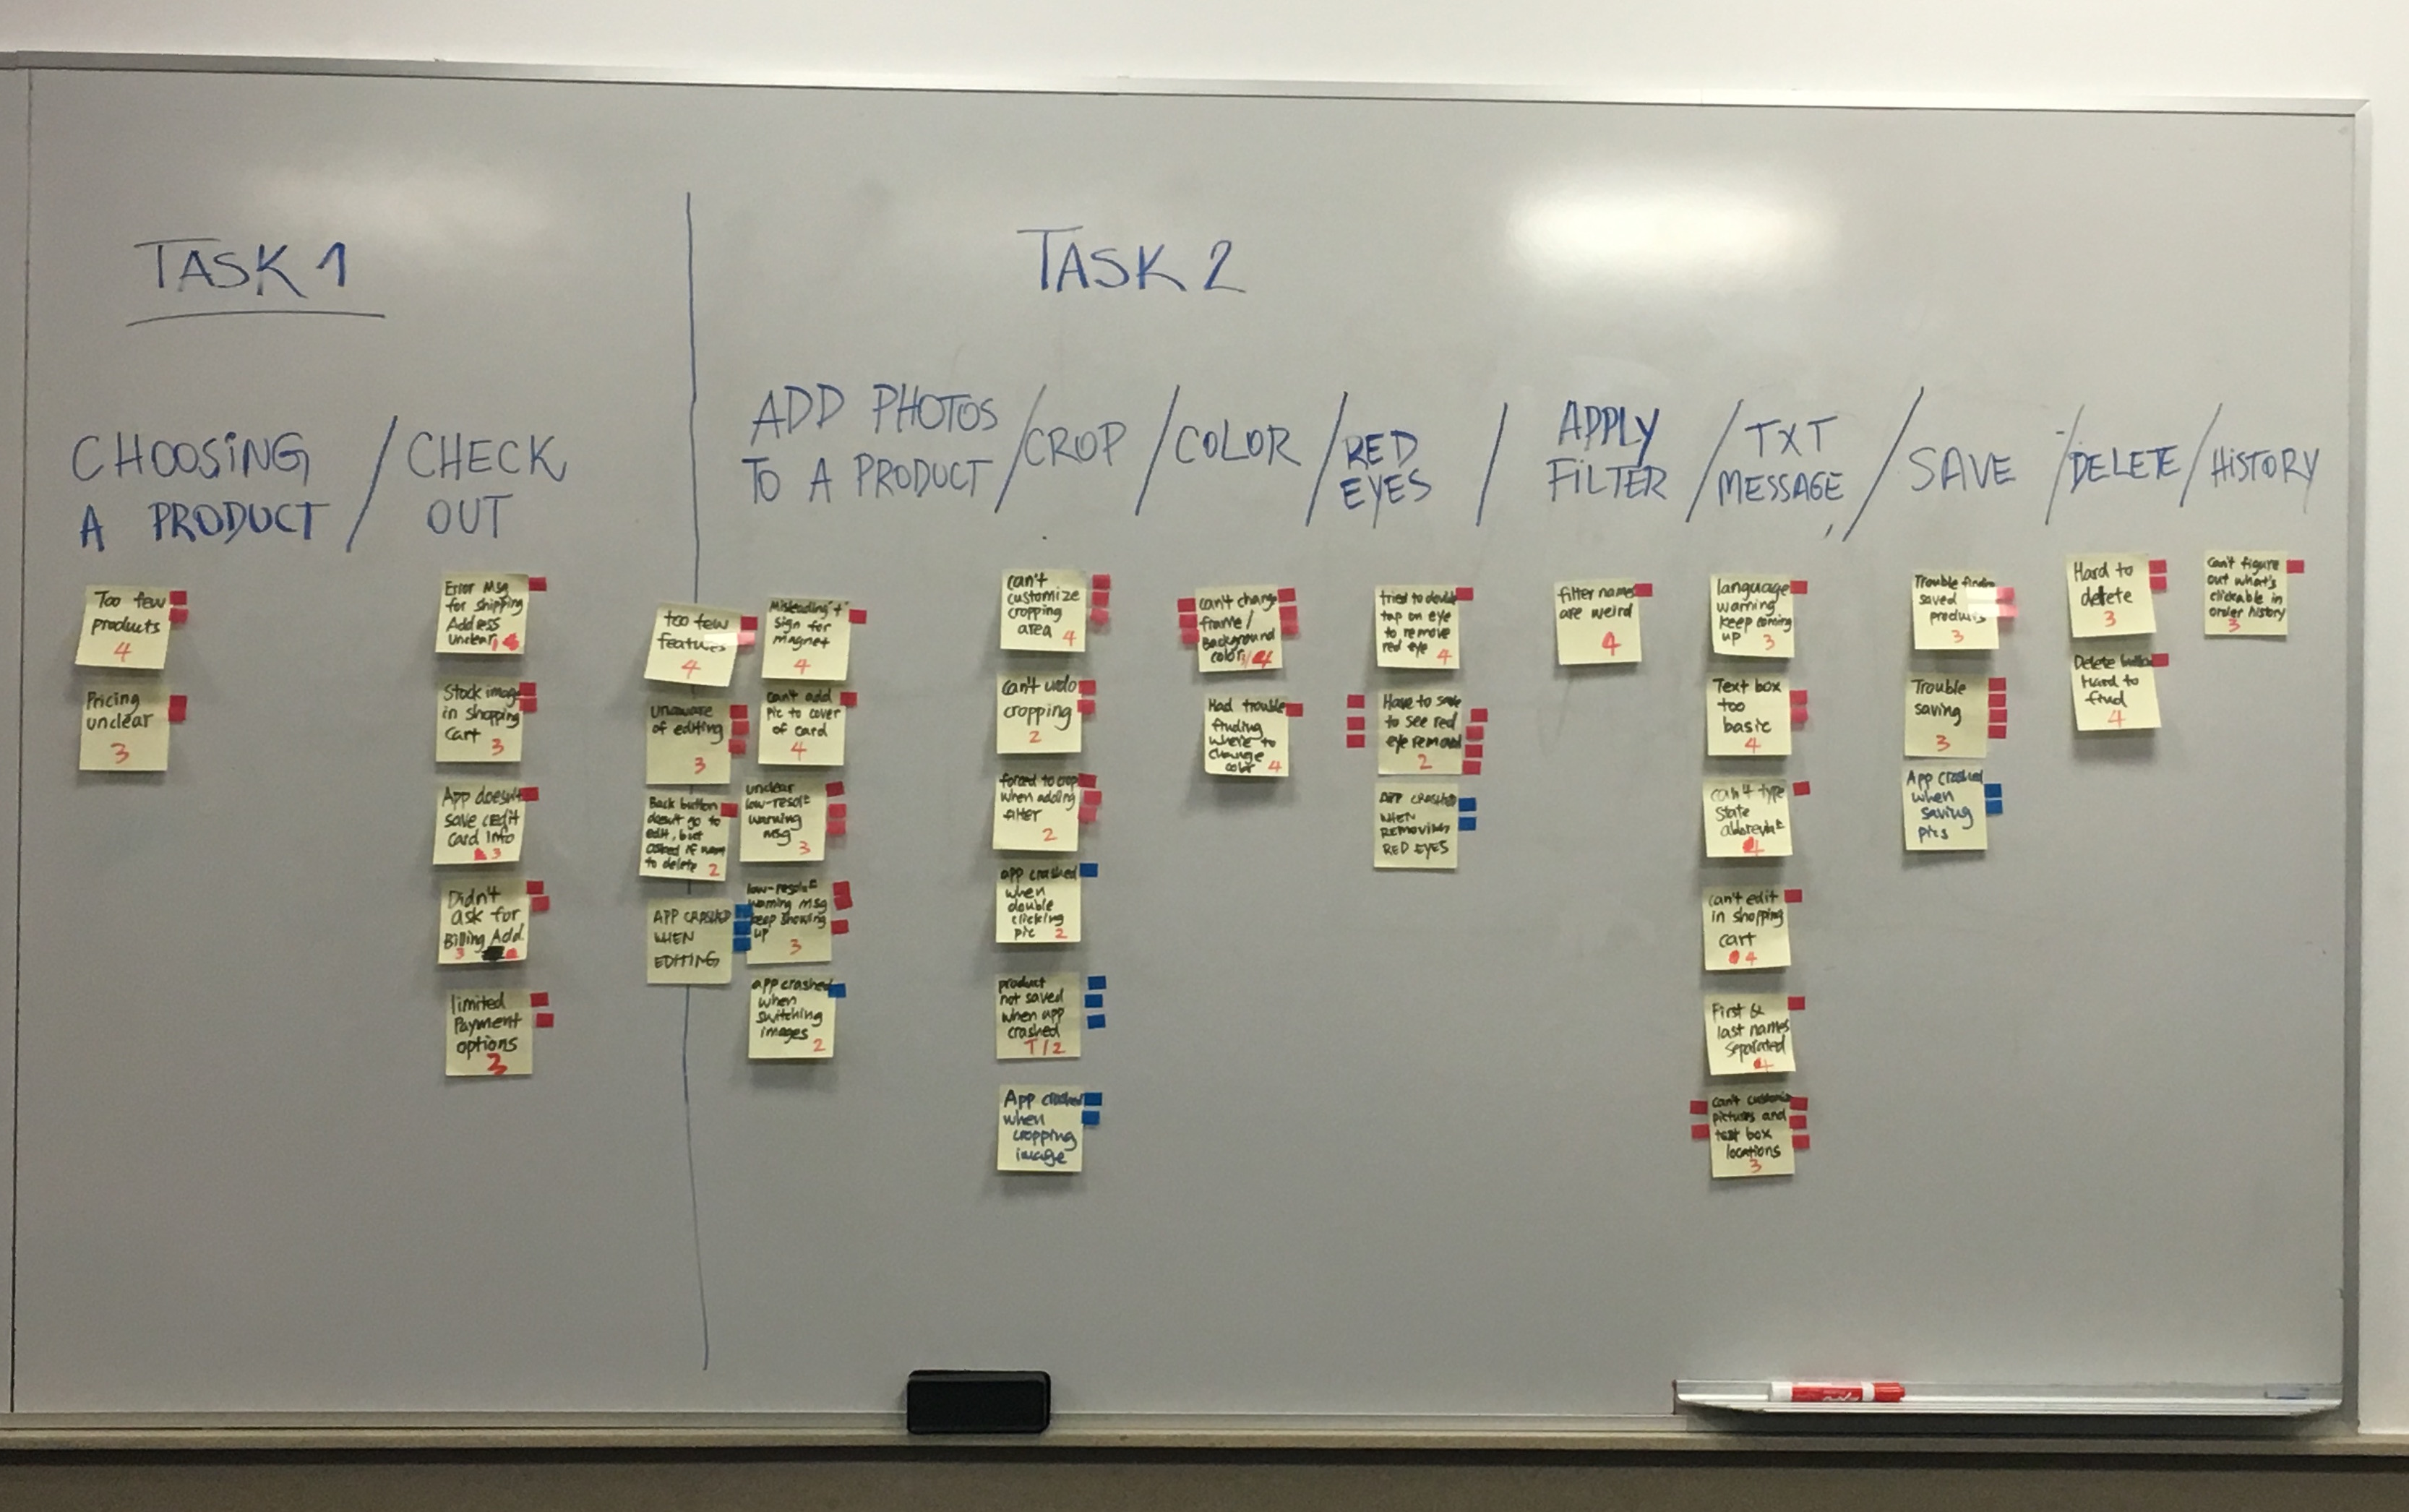
This is how we originally categorized the issues list.
- I created graphs that helped us easily recognize problematic sections and identify their related severity.
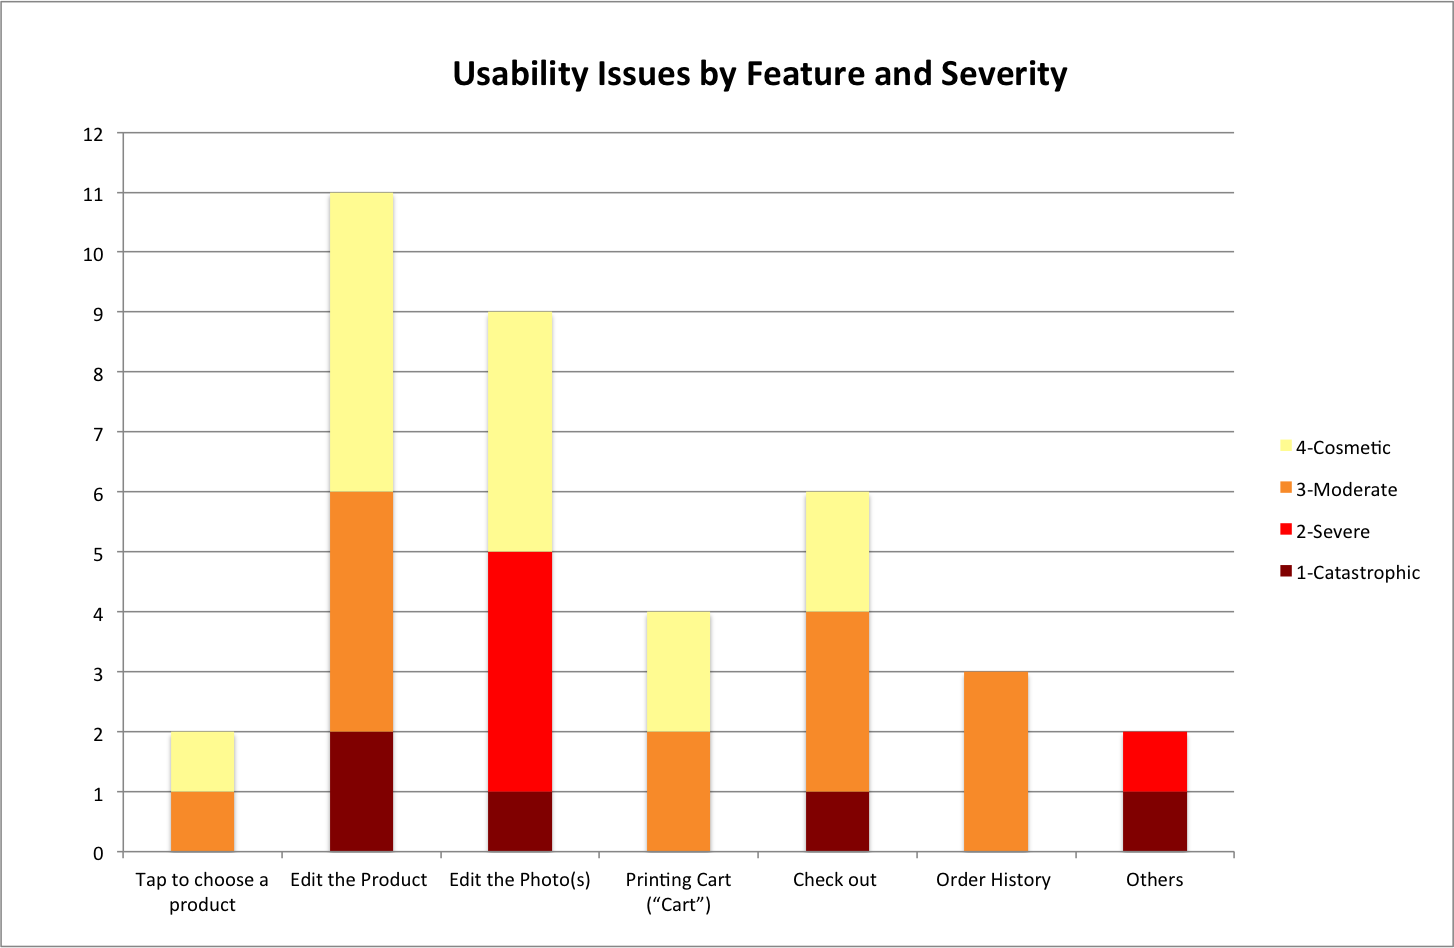
This is an example of the graphs that I created.
- Most importantly, we came up with a series of actionable recommendations.